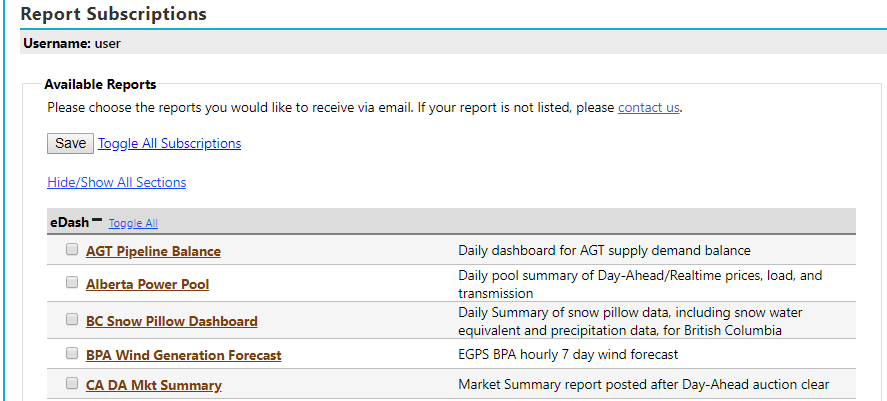
Email subscriptions for each of our reports can be changed under User Preferences > Report Subscriptions. This page shows the full list of subscriptions available to you separated into broad categories by type.
The checkbox on the left can be toggled to turn on turn of your subscription to that report, and then the Save button at the top of the page will save your preferences. For your convenience, a sample of each report can be viewed by clicking on the report title. This is the brown link directly to the right of each checkbox.
Clicking on each category header will collapse all of the subscriptions under it. Additionally, there is a Toggle All link that will subscribe or unsubscribe you from that entire category. Finally, at the top of the page we have a Hide/Show All link and a Toggle All Link that will collapse/expand all of the categories or check/uncheck all of your subscriptions respectively.
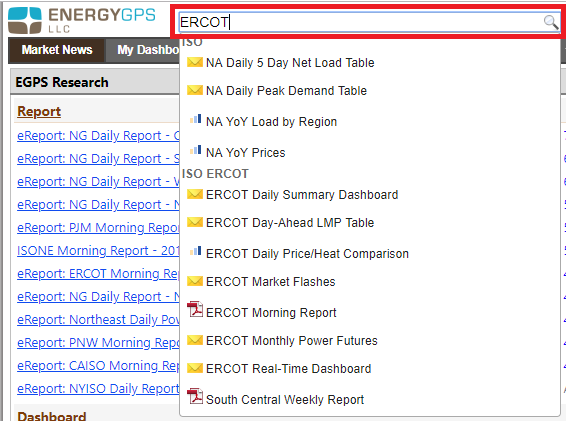
For our enterprise users, all of the content accessible to you can be searched via the search bar at the top of our site.
Here at EnergyGPS, we're always looking for ways to expand our research further into the realm of energy. If you can't find exactly what you're looking for, feel free to contact us with questions or recommendations for new data or features that can help us better serve you.
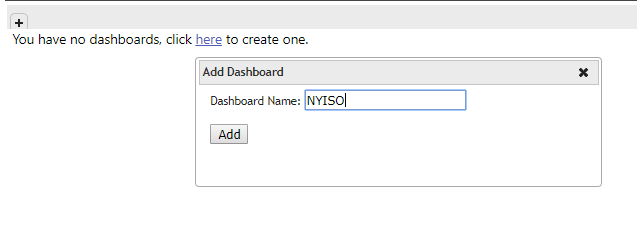
Create your first dashboard by either clicking on the "+" tab in the top left corner, or by clicking the "click here" link.
In the pane that appears, give your dashboard a name. For this example, we'll name it "NYISO".
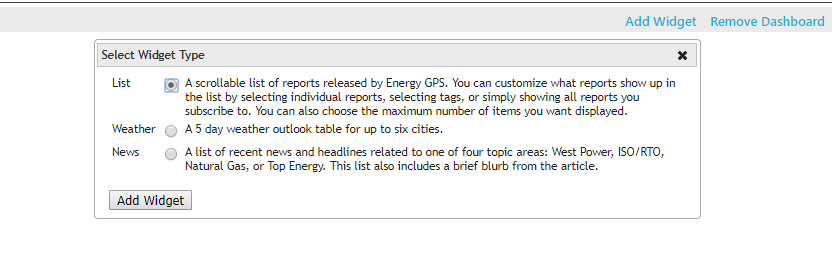
Now we have an empty dashboard. Each dashboard can contain different widgets, each of which will provide a different stream of information. To add a new widget, click the "click here" link if adding one for the first time or click the "Add Widget" link on the top right corner of the page.
In the pane that appears, select the type of information you'd like the widget to display. For this example, we'll be picking the "List" type so that we can view the EGPS reports we're most interested in.
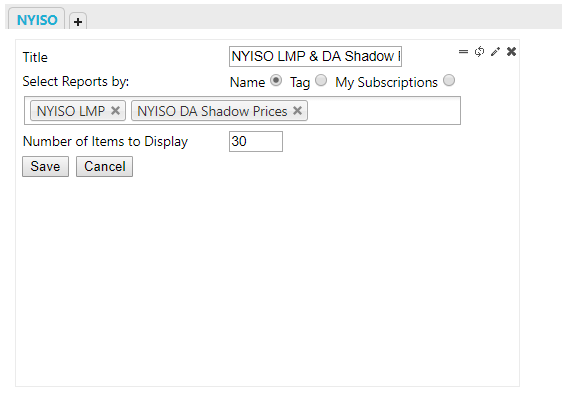
Now we need to fill out our new Widget's settings. For this example, we'll search for our NYISO LMP and NYISO DA Shadow Prices reports by name and the click on "save" to save the widget.
In the top right corner of each widget are a set of icons for handling these widgets. The leftmost two vertical bars can be dragged around the page to re position the widget. The circular arrows refresh the widget by checking for the latest data available. The pencil icon opens that widget's configuration. The x button allows you to remove the widget.
In the top right corner of the page there is also a "remove dashboard" link that allows you to completely delete the current dashboard. If you have multiple dashboards created, an additional "set as default" button that will make this dashboard the one that initially opens when you visit this page.
There are three ways you can export data from our site:
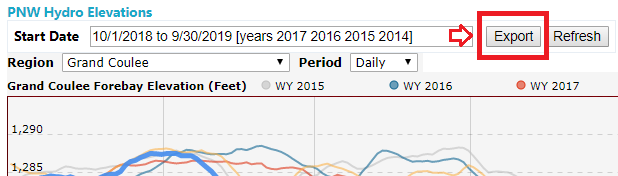
If you are looking at one of our interactive charts, there is an export button above each graph that will download you a csv file of that data.
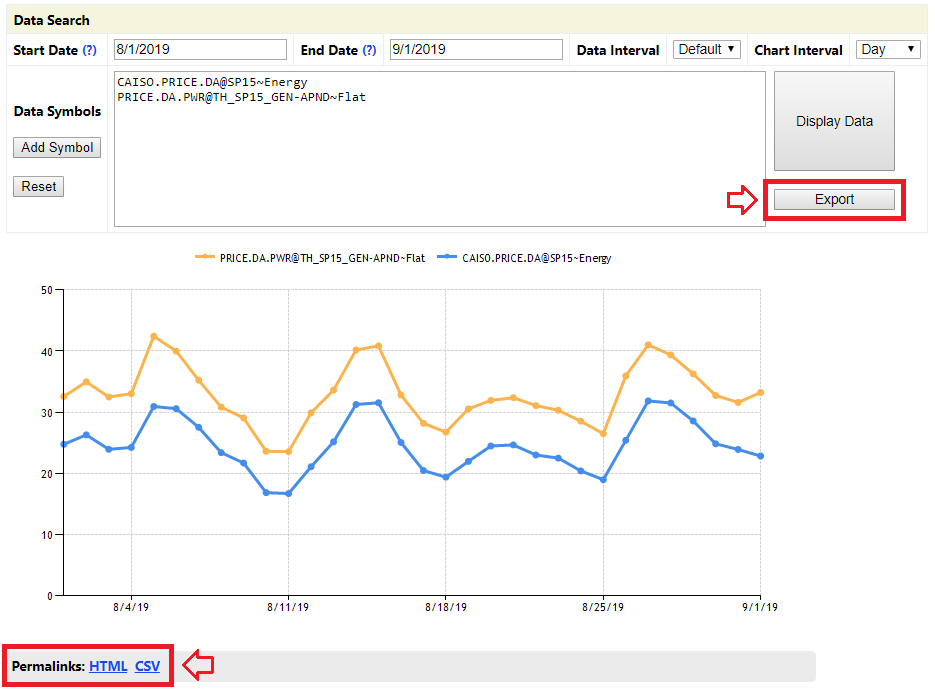
Our Data Query Tool is an Enterprise level feature that allows users to write and graph their own queries against our data. After you generate a chart, you can click on the "Export" button to save the data as a csv, or you may click on the "HTML" or "CSV" permalinks under the graph to link back to either the data query page or the csv data respectively.
We also have programmatic access to our data available to our Enterprise customers via the Time Series API. You can contact us to set up an API key or a free trial.
For consulting services or enterprise features, trials and samples are given out on a per customer basis. Please contact us to inquire about the service or feature you would like to demo.
Our free daily newsletter is a shallow dive into many of the topics we often write about for our more in-depth weekly articles and monthly recaps. You can subscribe to our daily newsletter to get an idea of the topics and content we normally write about.
Enterprise customers can find old reports can be found under Research > Report Search. Here you may search for reports by subject and/or time range, or you may leave the subject line blank and hit filter for a full list of reports available to you. If your reports do not show up or the link appears to not be clickable, please contact us for further assistance.
Silver tier or above newsletter customers can search for our old newsletters via the Google search engine. You can search for "site:www.energygps.com newsletter <keywords>" on Google and they will return our most relevant newsletters to your search.
eReport - Written by EGPS staff and has some pertinent information to a specific commodity/region.
eFlash - Written by EGPS staff on some information that came out within the day that has some sort of impact in a specific market.
eFlash Auto - This is a canned report sent to clients once some information is new at a specific source. EGPS staff created the report layout and wrote the code to display the information in a pertinent manner. The report is triggered off of the job scheduler.
eDash - This is a canned report that comes out at a similar time every day. The template design is written by EGPS staff and is triggered by the job scheduler.
eNotice - Automated report that give the client a notice that something changed.
eAnnounce - Sent to clients, informing them of a new report on the website or something new to the product.
Newsletter Content Types
Blog - Free daily commentary, written by EGPS staff.
Article - Two/three pages of written commentary, tables and charts that detail something happening in the energy sector.
Special Report - Three/five pages of written commentary, tables and charts that take a deeper dive into a specific component tied to the energy space.
Monthly Report - A standard written report tied to the energy space that is published once a month, and gives the reader an overview of what has transpired along with where the trends are headed.
For security purposes, accounts are locked after a certain amount of consecutive failed login attempts. To unlock your account, please contact us and provide either the username or email associated with the account and we will be able to reset your account. Note that while we will have to generate a new password for your account, you will be able to reset it after logging in by visiting User Preferences > Change Password page.
Passwords can be reset from our Forgot Password page. After filling out and submitting the form, we will send you an email shortly after to set a new password.
We separate both months into halves due to annual rules regarding fish spill for the hydro projects in the Lower Snake and Lower Columbia basins that significantly impact generation part-way through each month. These stricter fish spill requirements kick in part way through April and mean that the greater portion of inflows to these hydro projects do not pass through the generators in the dams but are diverted into spill, thus decreasing generation. These requirements end in mid-August, where we see a significant increase in generation on similar inflows. For our hydro forecasts, “Apr” and “Aug” refer to the first 15 days of April and August, respectively, while “Apr1” and “Aug1” refer to the remainder of each month.
Our Normal forecast refers to the expected monthly generation based on average flows and conditions. We use the official normal unregulated Jan-Jul, Apr-Jul, Jan-Aug, and Jan-Sep seasonal flows at The Dalles, Lower Granite, and Grand Coulee from the Northwest River Forecast Center (NWRFC), which consist of the 30-year average from 1991-2020. These flows are used as inputs in our long-term hydro forecast model, which accounts for typical project operations with respect to flood control draft and refill as well as fish spill requirements. These requirements and directives are updated periodically, and our Normal hydro forecast is updated to account for these changes.
We divide the PNW hydro system into different basins or collections of projects by region. See Table 1 and Figure 1 below for a list of projects by river basin and map.
Table 1
Dam
River Basins
Above Grand Coulee (AGC)
Albeni Falls, Boundary, Box Canyon, Cabinet Gorge, Hungry Horse, Kerr, Little Falls, Libby, Long Lake, Nine Mile, Noxon, Thompson Falls
Upper Columbia (UC)
Chief Joseph, Grand Coulee
Middle Columbia (MC)
Priest Rapids, Rock Island, Rocky Reach, Wanapum, Wells
Middle Snake (MS)
Brownlee, Hells Canyon, Oxbow
Lower Snake (LS)
Dworshak, Ice Harbor, Little Goose, Lower Monumental, Lower Granite
Lower Columbia (LC)
Bonneville, John Day, McNary, The Dalles
Westside (WS)
Alder, Chelan, Cowlitz, Diablo, Electron, Green Peter, Jackson Hydro, La Grande, Lower Baker, Lookout Point, Mayfield, Merwin, Mossy Rock, Ross, Snoqualmie Falls I, Snoqualmie Falls II, Swift 1, Swift 2, Upper Baker, Yale
Willamette Valley (WV)
Big Cliff, Cougar, Detroit, Dexter, Foster, Hills Creek, Lost Creek, Pelton, Round Butte